Paraprofessional and Auxiliary Transitions: Newly Hired Teachers
The Newly Hired Teachers page details counts and percents of paraprofessional and auxiliary staff hires with their certification types and can be compared to counts and percents of other newly hired teachers. By reviewing this data, school systems can track transitions to teaching trends among paraprofessional and auxiliary staff, address staffing gaps, and plan for future recruitment needs.
Navigate to the TalentED Dashbaords
-
Select TalentED Dashboards” from the Apps menu

-
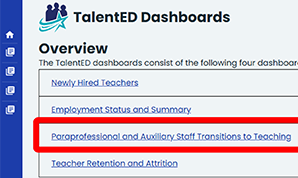
Select “Paraprofessional and Auxiliary Staff Transitions to Teaching” from the dashboard Overview list.
-
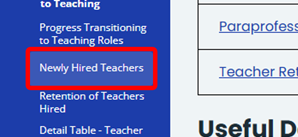
You may also select a dashboard from the blue margin menu.

-
Select “Newly Hired Teachers” from the Paraprofessional and Auxiliary Staff Transitions to Teaching Dashboard
to view overall counts and percentage data for paraprofessional and auxiliary staff hires, teacher certifications for paraprofessional and auxiliary staff hires, and those who were employed in the Texas public school system during the prior year.
Filter Newly Hired Teachers From Paraprofessional Staff
-
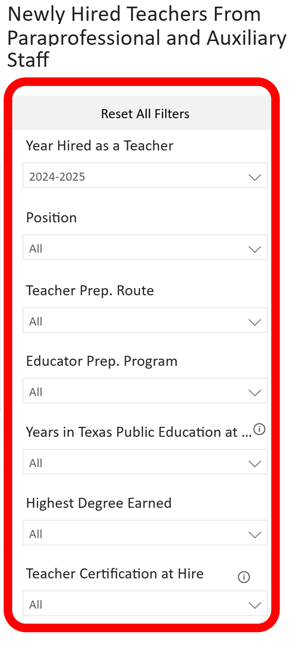
Use the Filter Selection Panel to explore Newly Hired Teachers From Paraprofessional and Auxiliary Staff data. You will be able to filter data according to:
- Year Hired as a Teacher
- Position
- Teacher Prep. Route
- Educator Prep. Program
- Years in Texas Public Education at Hire
- Highest Degree Earned
- Teacher Certification at Hire
-
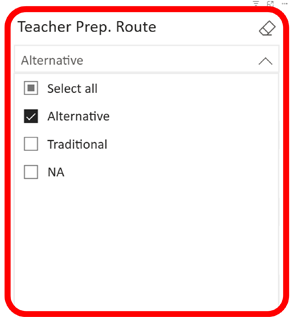
Click the arrow icon on any filter in the Selection Panel to view a list of options for viewing Employment Status Through Time data.
- Click the box(es) next to the options you want to view. Multiple boxes can be selected at one time. You can also click “Select all”.
- To clear a selection, uncheck the checkbox or click the eraser icon to clear all the checkboxes in that filter.
- To start over, you can click the “Reset All Filters” button. This will clear all selections that have been made in the Filter Selection Panel.
-
Hover the cursor over the “information icon” to view a detailed description and information about that filter.

View Hires from Paraprofessional and Auxiliary Staff
-
The first visualization under the Newly Hired Teachers From Paraprofessional and Auxiliary Staff Tab is titled “Hires from Paraprofessional and Auxiliary Staff.” The bar graph indicates the count of educational aides, substitute teachers, or other auxiliary staff hired at the LEA. Use the filters along the left-hand side to dynamically change the bar graph’s view.

-
Hover the cursor over a section of the bar graph to view detailed information about the data highlighted

View Teacher Certifications of Hires from Paraprofessional and Auxiliary Staff
-
The next visualization under the Newly Hired Teachers From Paraprofessional and Auxiliary Staff Tab is titled “Teacher Certifications of Hires from Paraprofessional and Auxiliary Staff.” The pie chart indicates the count and percentage of paraprofessionals or auxiliary staff hired at the LEA by certification type. Use the filters along the left-hand side to dynamically change the pie chart’s view.

-
Hover the cursor over a section of the pie chart to view detailed information about the data highlighted.

View Total Hires Who Were Paraprofessional or Auxiliary Staff in the LEA in Prior Year
-
The final visualization under the Newly Hired Teachers From Paraprofessional and Auxiliary Staff Tab is titled “Total Hires Who Were Paraprofessional or Auxiliary Staff in the LEA in Prior Year.” The line graph indicates the count or percentage of paraprofessionals or auxiliary staff hires who were employed at the LEA in the prior year. Use the filters along the left-hand side to dynamically change the line graph’s view.
Use the Display Selector on the right to view the count or percent of Newly Hired Teachers.

-
Hover the cursor over a section of the line graph to view detailed information about the data highlighted.
