Employment Status and Position: Through Time
The Employment Status Through Time page longitudinally details percents of teachers by status and certification type. By reviewing this data, school systems can identify trends across positions, address staffing gaps, and plan for future recruitment needs.
Navigate to the TalentED Dashbaords
-
Select "TalentED Dashboards" from the Apps menu.

-
Select “Employment Status and Summary” from the dashboard Overview list.

-
You may also select a dashboard from the blue margin menu.

-
Select “Employment Status Through Time” from the Employment Status and Summary Dashboard to view data for percents of teachers employed through time by Source and by Certification

Filter Employment Status Through Time Data
-
Use the Filter Selection Panel to explore Retention of Teachers data. You will be able to filter data according to:
- Hire Year
- Source
- Certification at Hire
- Years of Teaching Exp. at Hire
- Campus Level at Hire
- Campus at Hire
- Prog./Pop. Served at Hire
- EPP Route
- EPP
- Teacher Race/Ethnicity
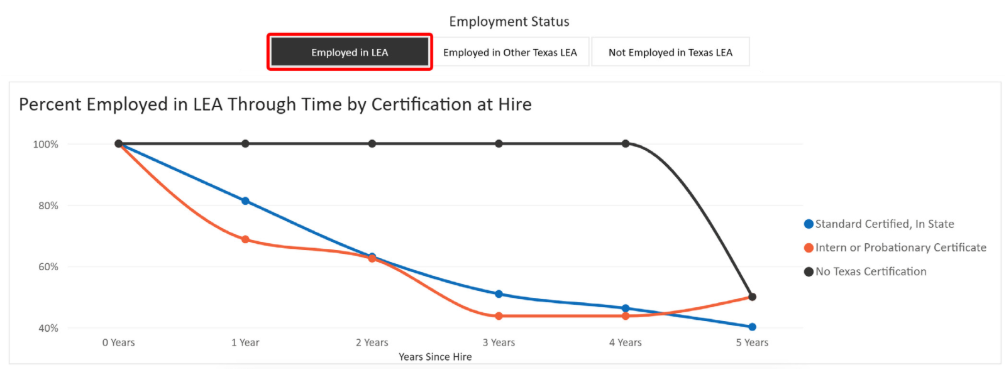
Use the top filter panel, "Employment Status" to focus on the following sets of data:
- Employed in LEA
- Employed in Other Texas LEA
- Not Employed in Texas LEA

-
Click the arrow icon on any filter in the Selection Panel to view a list of options for viewing Employment Status Through Time data.
- Click the box(es) next to the options you want to view. Multiple boxes can be selected at one time. You can also click “Select all”.
- To clear a selection, uncheck the checkbox or click the eraser icon to clear all the checkboxes in that filter.
- To start over, you can click the “Reset All Filters” button. This will clear all selections that have been made in the Filter Selection Panel.
Click a tab in the “Employment Status” filter at the top to focus on employment type in a Texas School System.

-
Hover the cursor over the “information icon” to view a detailed description and information about that filter.

View Employment Status Through Time by Source
-
The first visualization under the Employment Status Through Time Tab is titled “Percent Employed in LEA Through Time by Source.” The line graph indicates the percent of newly hired teachers that were employed in an LEA from 0 to 5 years. Use the filters along the left-hand side and top to dynamically change the line graph’s view

-
Hover the cursor over a point of the line graph to view detailed information about the data highlighted.

View Employment Status Through Time by Certification at Hire
-
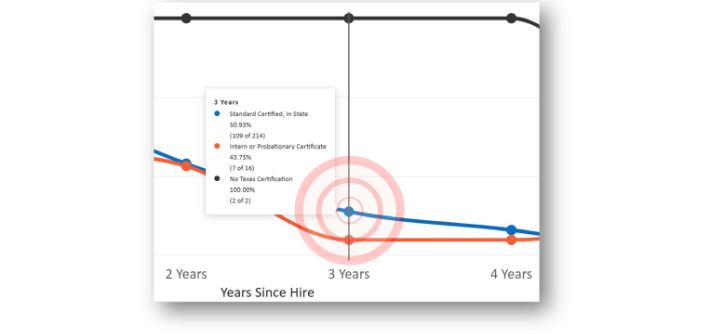
The next visualization under the Employment Status Through Time Tab is titled “Percent Employed in LEA Through Time by Certification at Hire.” The line graph indicates the percent of newly hired teachers by certification type that were hired by an LEA across multiple years. Use the filters along the left-hand side and top to dynamically change the bar graph’s view.
-
Hover the cursor over a point of the line graph to view detailed information about the data highlighted.