Teacher Retention and Attrition: Explorer
The Explorer page provides a customization tool to view teacher retention and attrition data. By reviewing this data, school systems can identify retention trends by grade level and subject area, address staffing gaps, and plan for future recruitment needs.
Navigate to the TalentED Dashboards
-
Select "TalentED Dashboards" from the Apps menu.

-
Select “Teacher Retention and Attrition” from the dashboard Overview list.

-
You may also select a dashboard from the blue margin menu.

-
Select “Explorer” from the Teacher Retention and Attrition Dashboard to disaggregate detailed teacher retention data.

Filter Teacher Retention Explorer Data
-
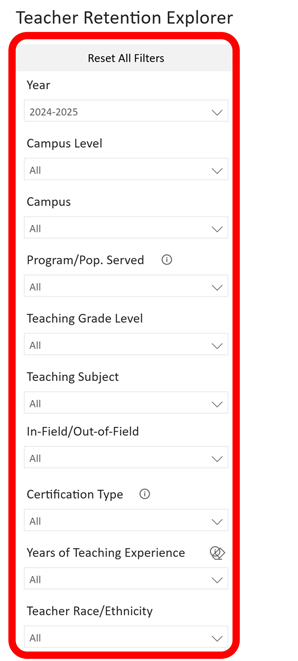
Use the Filter Selection Panel to explore Teacher Retention Explorer Data. You will be able to filter data according to:
- Year
- Campus Level
- Campus
- Program/Pop. Served
- Teaching Grade Level
- Teaching Subject
- In-Field/Out -of-Field
- Certification Type
- Years of Teaching Experience
- Teacher Race/Ethnicity
-
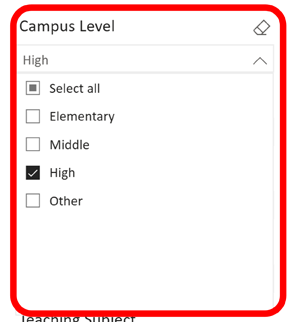
Click the arrow icon on any filter in the Selection Panel to view a list of options for disaggregating the Teacher Retention Explorer data.
- Click the box(es) next to the options you want to view. Multiple boxes can be selected at one time. You can also click “Select all”.
- To clear a selection, uncheck the checkbox or click the eraser icon to clear all the checkboxes in that filter.
- To start over, you can click the “Reset All Filters” button. This will clear all selections that have been made in the Filter Selection Panel.
-
Hover the cursor over the “information icon” to view a detailed description and information about that filter.

Disaggregate Teacher Retention Explorer Data
-
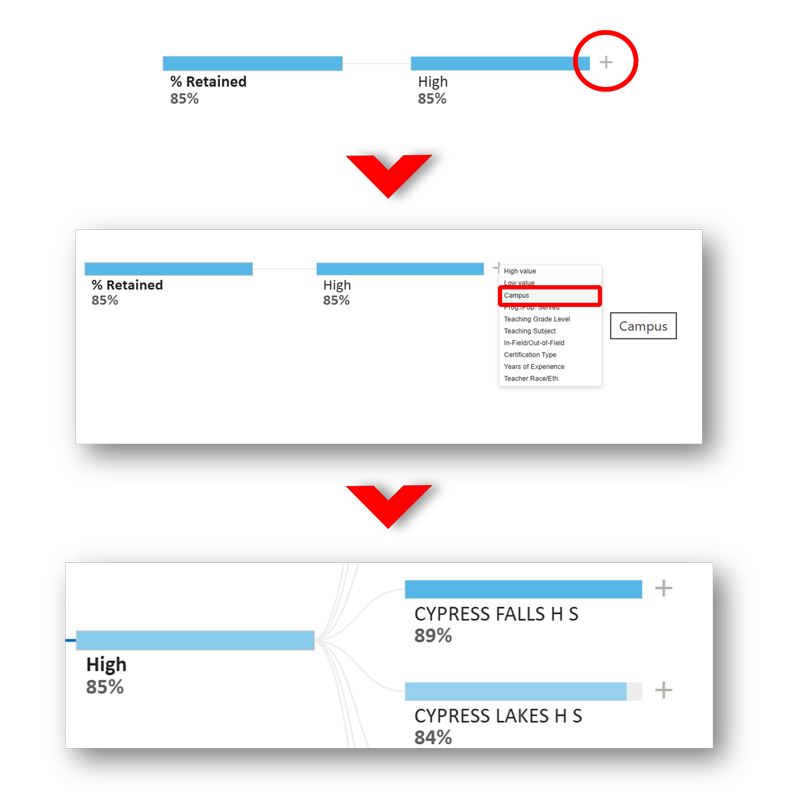
Select subtree variables in the Explorer visualization by clicking on the “+” sign to split the percentage of retained teachers. Subtree variable filter options will be displayed as a pop-up box when the “+” sign is clicked. Continue selecting subtree variables using the “+” signs in each column to further disaggregate the data.
-
Click the “x” at the top of a column to collapse the subtree branch. You can choose to collapse the columns and branches in any order.
